The work of a call center is not only about calls, but also about the contact center analytics in reports, which provide an understanding of how the team operates. Who among the agents handles calls better, where do issues arise, how many calls go through the lines per day? Our call center reporting tools – Oki-Toki “Reports” provide answers to these questions.
With “Reports”, you save time thanks to simple management, go to the mail – and receive a report for the needed period. Following the link from the email, opens the history of changes in the call center indicators: what was yesterday, the day before, or a month ago. For instance, if the number of dropped calls has increased – agents can be added. All of this makes the work more transparent and predictable.
In the article, we will discuss why contact center “Reports” are indispensable for managers and supervisors.
The benefits of “Reports”
The report collects data and transforms it into a convenient report. It’s not just tables with numbers, but ready answers to your questions: how each one works, where calls are lost, how efficiently the load is distributed.
- Time-saving. All call center metrics are collected automatically: the number of calls received, how long clients waited for an answer, how long an agent was on the line and in what status. The “Report” is created once, and then automatically arrives by mail in ready form for the selected period.
- Accuracy of information. The system itself collects and structures the data. You see verified and current information that can be immediately used.
- Simple and convenient. Summaries are formulated so that you can evaluate the productivity of the work and compare the results with other periods.
“Reports” gather all the necessary data from other Oki-Toki dashboards about the call center’s operation and show you this contact center data analysis. For example, if you see that clients are waiting on the line for too long and that SL goes over 20 seconds – you can immediately adjust the settings: add agents or redistribute the load to other queues.
What can be learned from the “Report”?
The “Report” in Oki-Toki contains different sections, each of which helps understand how your contact center works. It’s convenient for evaluating various indicators, such as, for instance, agent activity. You can also look into the costs of using the service. With such an approach, it will be much easier for you to understand what needs to be implemented: maybe your service costs have increased and something needs to be optimized, and so on. You will always know where changes need to be made and where they do not.
Below we have given an example of several sections to pay attention to.
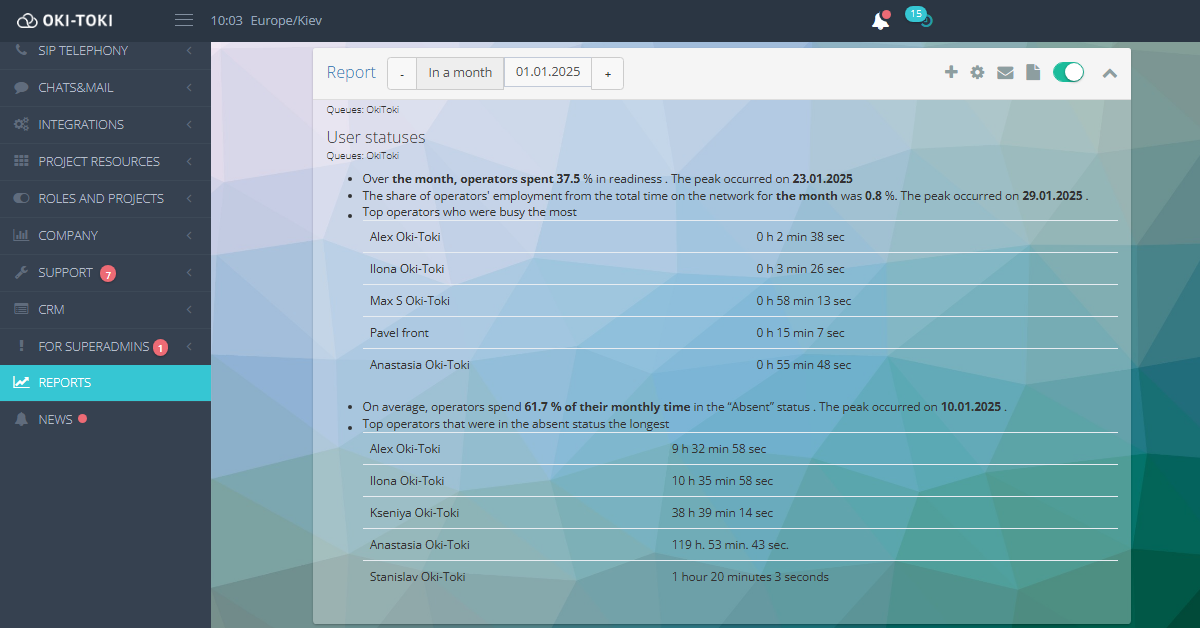
User statuses
This section shows how agents use their work time. It displays the total readiness time, the share of busyness, and periods of agent absence. You can also see which of the employees spent the most time online or in the “Busy” status. For example, you can see which employees are working better and who is too often in the “Away” status.
If an agent is “Away” – it means he is not working, so, it is necessary to find out why he is idle for so long. Perhaps, the agent is facing difficulties, and additional training is required.
When one agent handled 50–60 calls per shift, and another only 20 – it’s already a signal to check the uniformity of the load distribution.
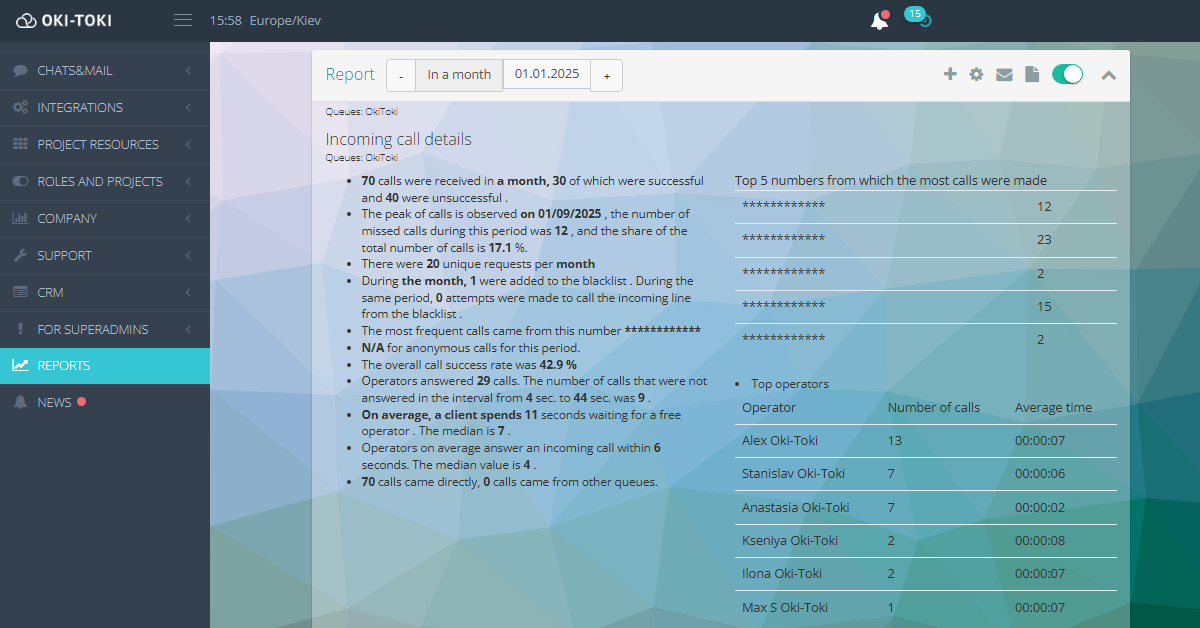
Information on incoming calls
The “Report” will show at what hours your load on the incoming queue reaches its peak, and at what time agents are idle. If you see that the peak of calls occurs from 11:00 to 12:00 and there are not enough managers, but from 15:00 to 16:00 there are no calls, then most likely, it is necessary to optimize work schedules. Because if clients wait on the line for too long, they may not wait for a free agent and hang up.
You can also see which phone number calls most often, maybe a client could not get through, or it is a spam number and needs to be added to the blacklist.
Additionally, you can look at the average amount of time agents take to answer a call. If you see that they respond to calls within 60–80 seconds, that’s not very good. It indicates that clients are waiting on the line for more than a minute or that agents are not picking up the phone.
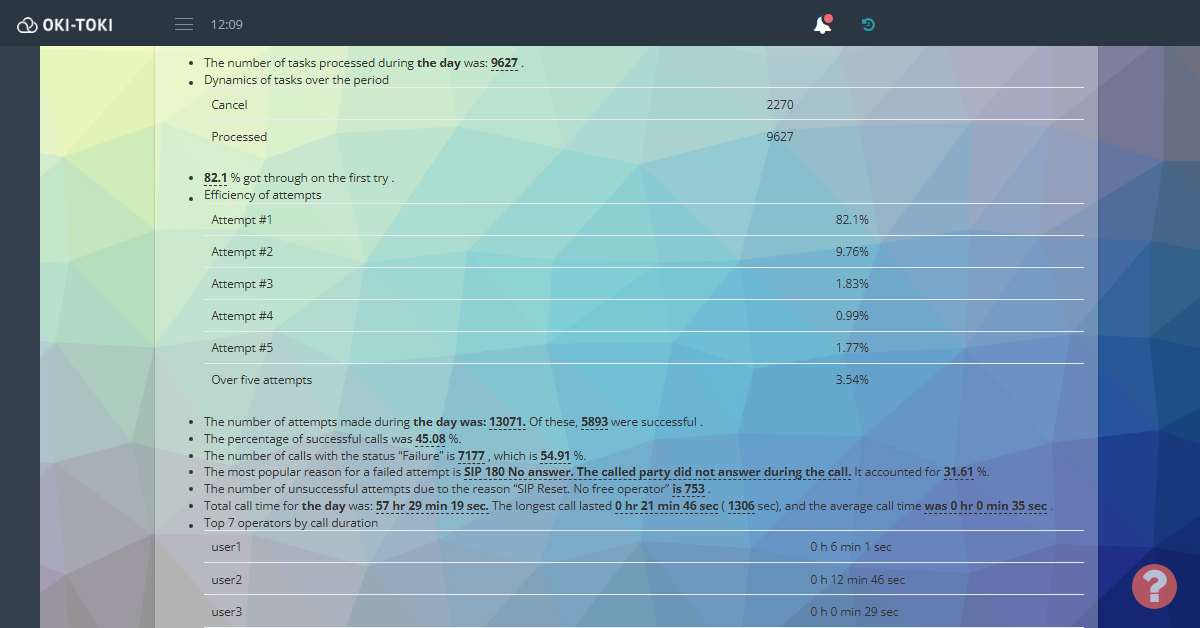
The work of the dialer
In this section, you will be able to see how well or poorly the dialer works. The main advantage – you can see how many attempts were made: per hour, day, or month for a specific dialer. What number of them were successful or unsuccessful, and what share of successful attempts per calls. You can also see how many calls agents missed and why.
For example, if there are too many drops due to the absence of a free agent, you can choose a different working mode for the dialer or reduce the number of lines being dialed.
You receive all data in figures and percentage ratios.
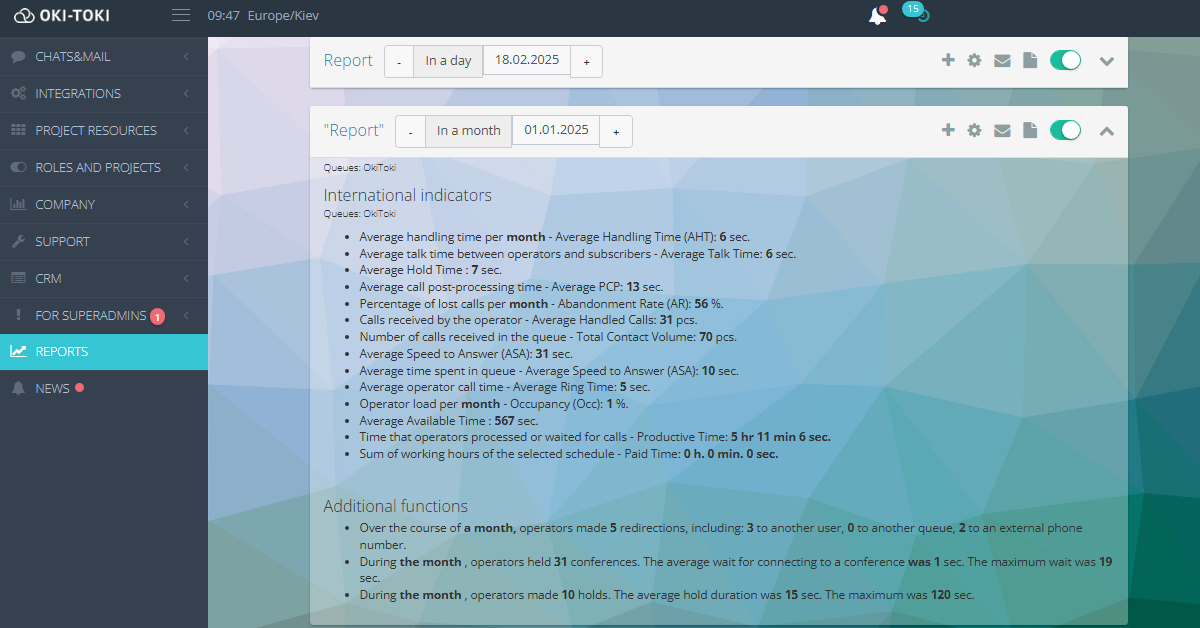
International indicators
The “Report” can show such metrics as the average handling time (AHT), clients answer speed (ASA), agent load (Occupancy), and abandonment rate (Abandonment Rate). For instance, if AHT is above average, it’s a reason to review scripts or simplify processes after calls. And a high Abandonment Rate will indicate that the waiting time for clients should be reduced, or the load redistributed among agents.
How to create a “Report” in Oki-Toki
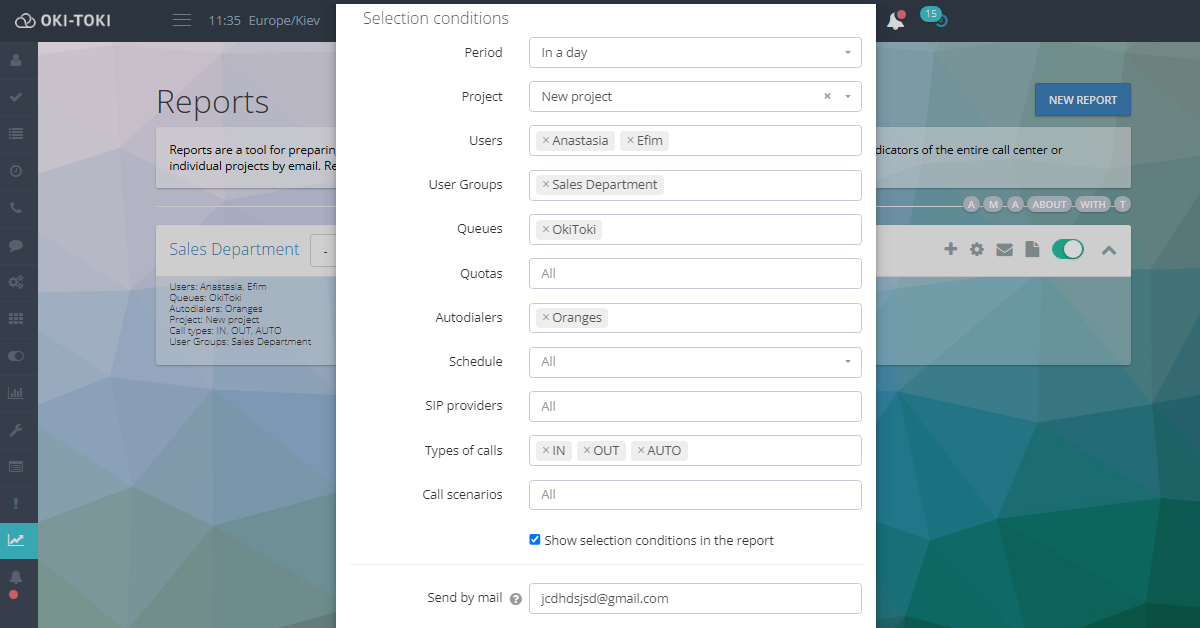
Go to the “Reports” section and press the “New report” button.
- In the selection criteria, specify the parameters you want to see, for example:
- Number of records – how many data rows should be displayed.
- Period – the time interval for which you want to get results: day, week, or month.
- Projects – for which projects to gather data.
- Queues and dialers – which queues or dialers to include in the “Report”.
- Set up the mailing – add email addresses to which the “Report” will automatically be sent. These can be your colleagues or supervisors.
- Fill the “Report” with sections:
Add the needed sections — it’s through them that you will be able to track key performance indicators for the contact center and analyze the work of the company, for example:
- Information on incoming calls: how many calls were received, how many were successfully processed, how many missed, unique inquiries, etc.
- User statuses: how much time agents spent in various statuses (for example, “Ready”, “Away”, “PCP”).
- The work of the dialer: successful calls, hang-ups, tasks processed, as well as the reasons for failed attempts, etc.
- CRM statistics: clients data in terms of answers collected by agents in the survey.
- International indicators: Average Available Time, Productive Time, et
Setting up “Reports” takes only a few minutes, and their effectiveness is noticeable from the first days. Monitoring call center indicators for supervisors and managers will become much easier.
In Oki-Toki, you can also create other detailed automated contact center reports, for example DataMixer.
Frequently Asked Questions
- What to do if the data is not displayed correctly? – Check the filter settings: perhaps, you accidentally excluded the necessary queues or agents.
- Is it possible to create a summary for a specific agent? – Yes, in the “Report” settings, select the needed user in the “Filters” section.
- Can daily insights on the contact center’s work with clients be produced? – Yes, the “Report” will collect a report based on answers to questions in CRM questionnaires. The report groups all answers within the selected question.
- How to view the statistics of IVR (voice menu) work? – For this, you need to add the “Call script data” section, which collects statistics on important elements of the call script.
- And how to receive a financial balance on the funds deducted from the account in Oki-toki? – Yes, such a “Report” can be received daily, weekly, or monthly. For this, there is a section “Costs in Oki-Toki”, where the details of the company’s deductions are found, as well as a list of functionalities the company uses.
Start using “Reports” in Oki-Toki and see how simple it is to manage a contact center, having all the necessary data at hand!