Creating reports for a call center is a process that requires a lot of time and effort. It is necessary not only to collect important data for analysis but also to make this process as simple as possible. In this article, we will tell you how to quickly and easily create a report that will meet your tasks using DataMixer.
1. What is a report builder?
2. Advantages of DataMixer by Oki-Toki:
3. How to set up DataMixer in Oki-Toki?
4. Managing DataMixer reports
5. What are the ways to create reports?
6. How to make an effective report for a call center?
What is a report builder?
The constructor is used to create individual reports that are not available in the program interface. This tool allows you to flexibly adjust parameters and combine different metrics according to specific tasks.This will be useful for managers, supervisors, analysts, executives, and QAM, solving tasks such as monitoring agents’ work, call analysis, quality assessment, and getting a visual picture of the call center’s operation.
DataMixer is an oki-toki tool that combines various reports into a single document. We have more than 36 reports in our system that contain information about the call center’s operation, and 7 of them can be combined using DataMixer:
For example:
- If you combine Call log and Survey statistics – the report will include information about calls and customer responses recorded by the agent in the survey;
- Agents log + Call evaluation log – data on agents’ working time and results of QAM checks;
- Combining SIP call log + IVR report will show how many calls went through the voice menu and which options customers chose;
- Agents log + Survey statistics – changing statuses at the agent’s workplace and filling out CRM surveys.
The main task of DataMixer is to combine different data that seem unrelated. With its help, you can collect KPI indicators, customer responses, survey data, and agents’ working time in one report for the call center. This simplifies analysis and provides an integrated view of the company’s operation.
Advantages of DataMixer by Oki-Toki:
Protected access
An important aspect for maintaining companies’ confidentiality policies. Only users with certain rights can create, edit, and receive reports. For working with the report builder there is a universal Admin role. You can create a new role and set the necessary permissions.
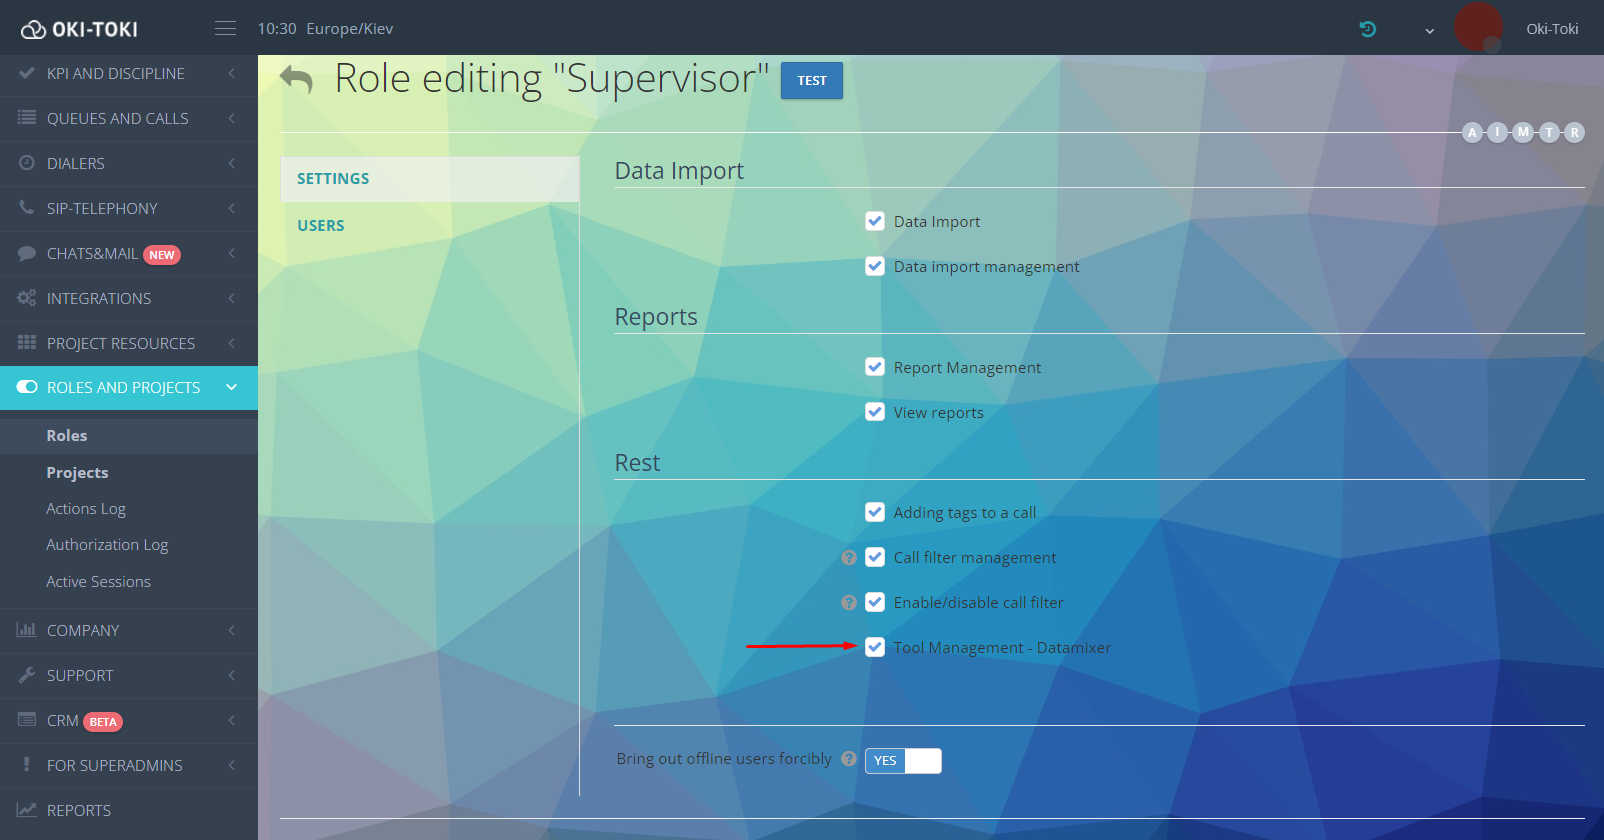
Read more about access rights in the article on the blog.
Report automation
Set up DataMixer and receive data according to the selected frequency. Notification of readiness will be sent to the email you specify in the settings. The letter will contain a link to the generated report, which you can download.
Important! The notification can be sent to the email of one or several users, which is convenient for distributing information between various departments.

Different modes for creating DataMixer
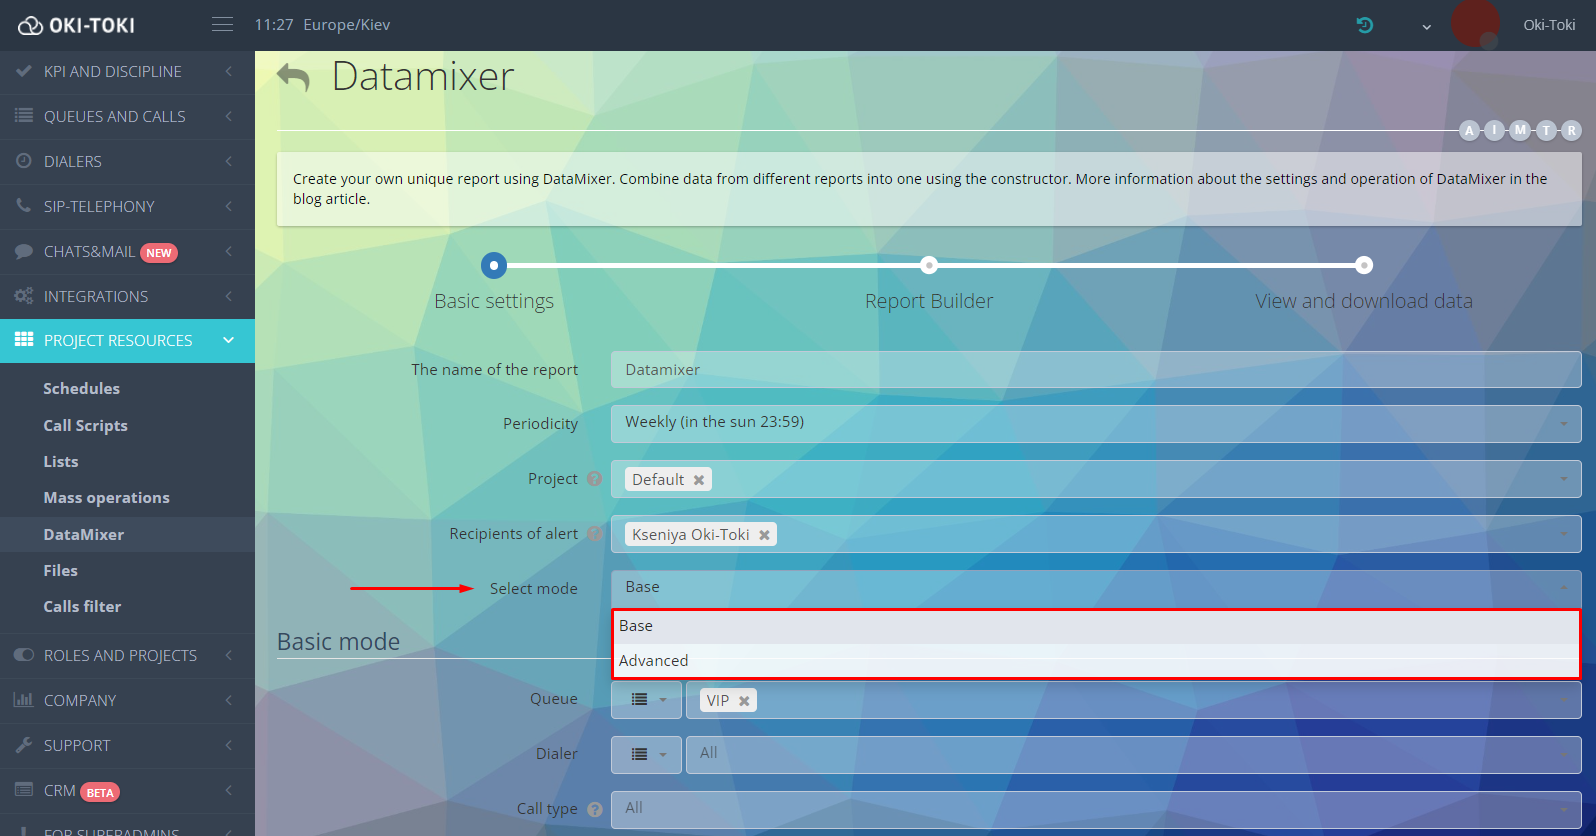
NEW! We have done a refactoring of the section, and now you can choose one of two options for formation:
- Basic – suitable for “newbies” as it is simple to use. All you need is to select the necessary fields and filters;
- Advanced – an optimized version of the “old” DataMixer, where links are formed manually.
Copying settings
Each DataMixer is essentially a template, and if you need several reports of the same format, you can copy its settings using the down arrow at the bottom of the page.

The analogue will be created automatically. If necessary, you can make changes or leave it in its original form. In the list, such a report will be named as a copy with the date of its creation indicated. If desired, it can be renamed.
NEW! Logging changes
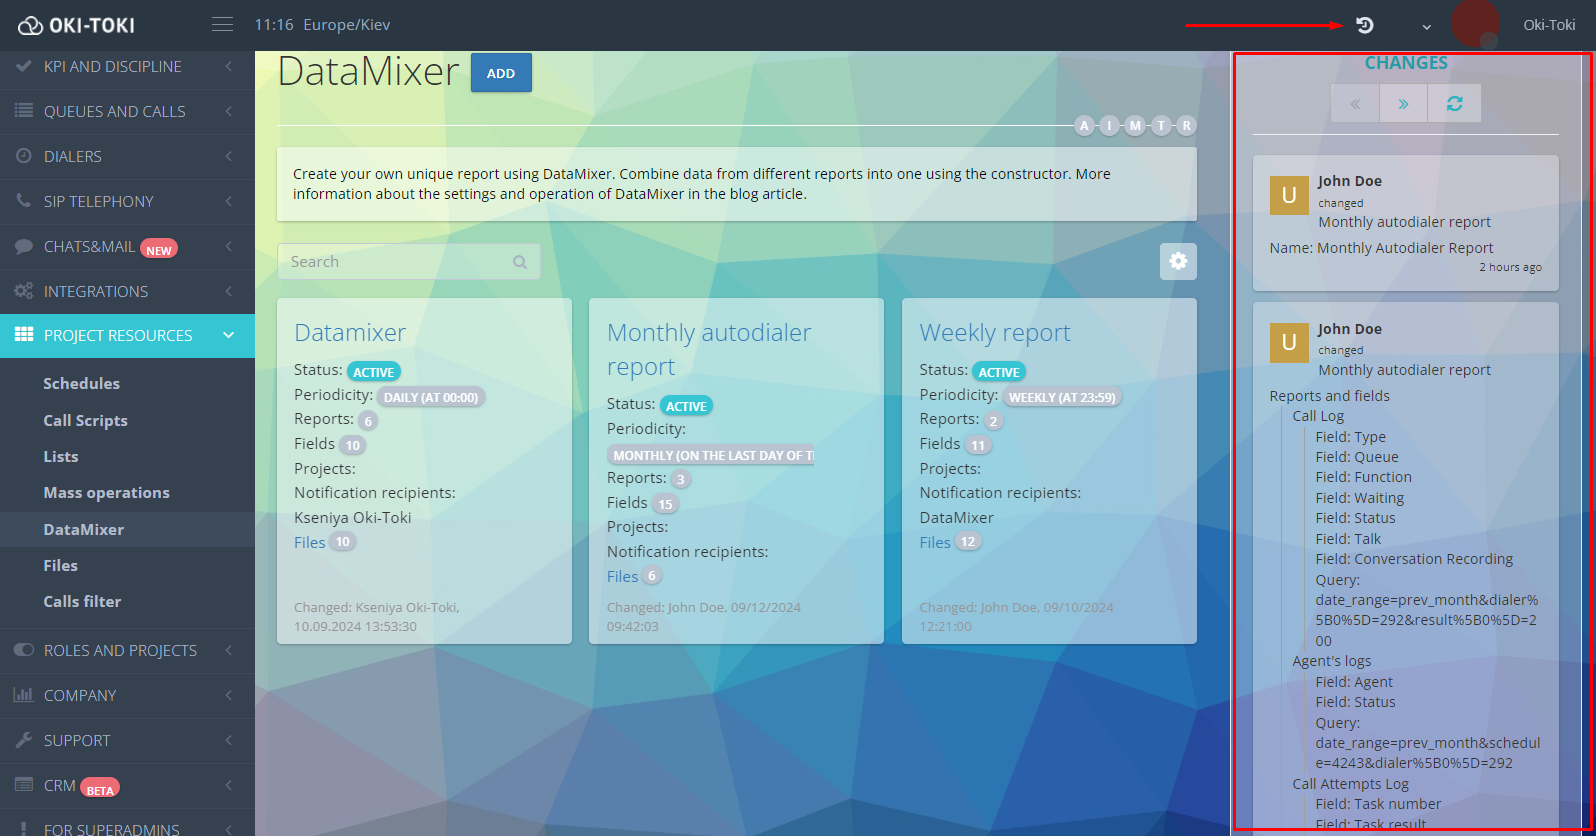
All changes that will be made in DataMixer are logged. For example, if a user changed the frequency, notification recipient, report parameters, or completely deleted it – all corrections will be indicated on the right panel.
How to set up DataMixer in Oki-Toki?
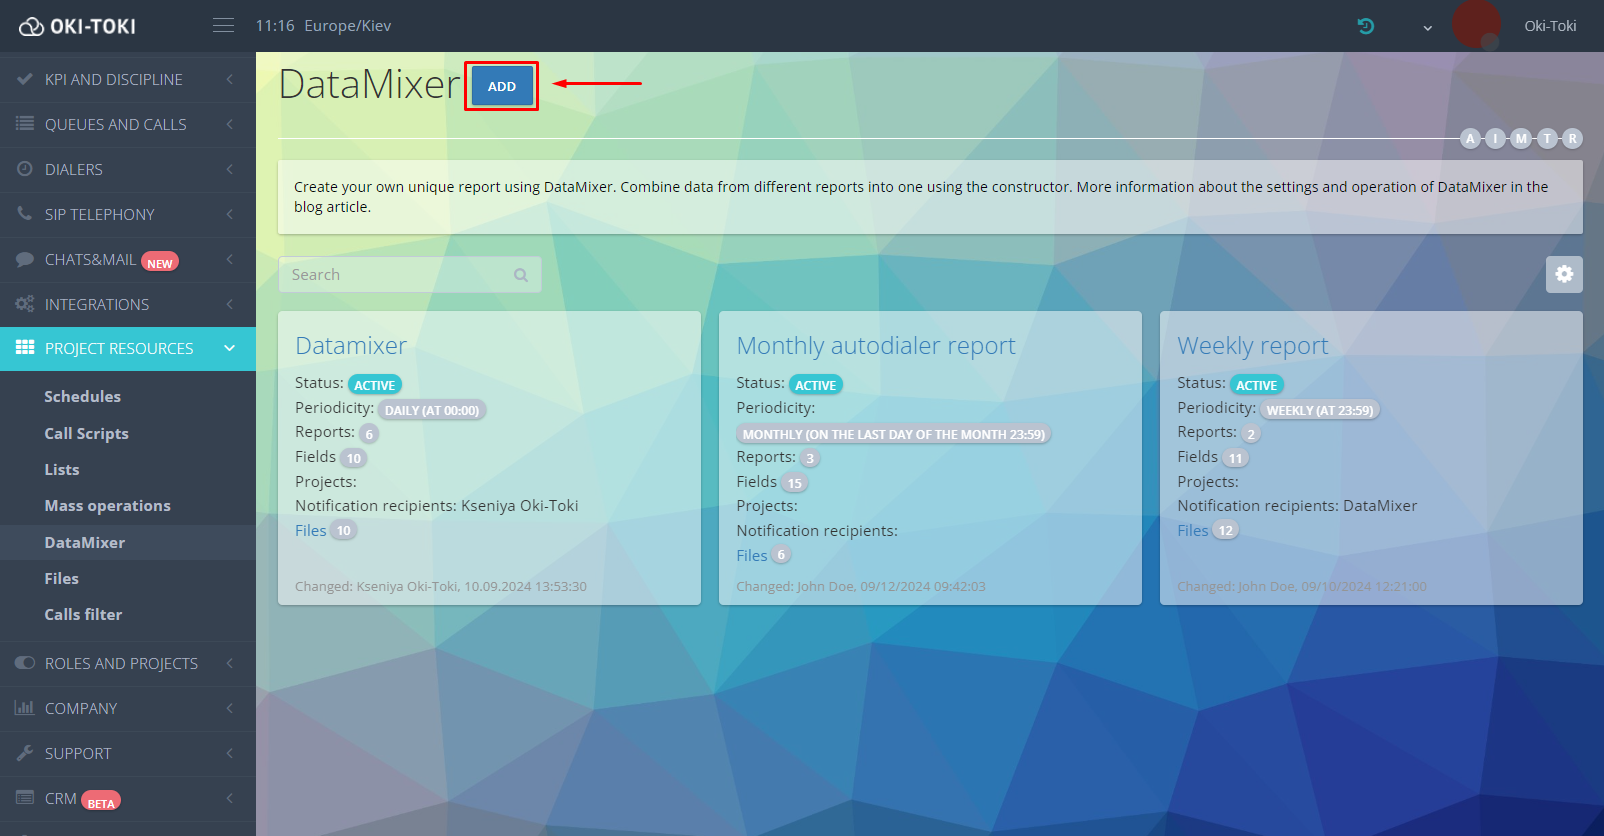
To create a report, go to the DataMixer section and click the “Add” button.
The process consists of three stages:
Stage 1: Basic settings
To start working in the report builder, specify the name and frequency – these are mandatory fields to fill out. You can select the time interval for forming: every hour, day, week, or month. All reports are generated for the past period. If the frequency field is not filled, the data will be formed by default:
- for the basic mode – for the last hour;
- for the advanced – according to the period specified in the URL link.
Select a project and specify the notification recipient of the report readiness. If the user is not added to the project, access to the data will be closed for them.Further settings depend on the selected mode.
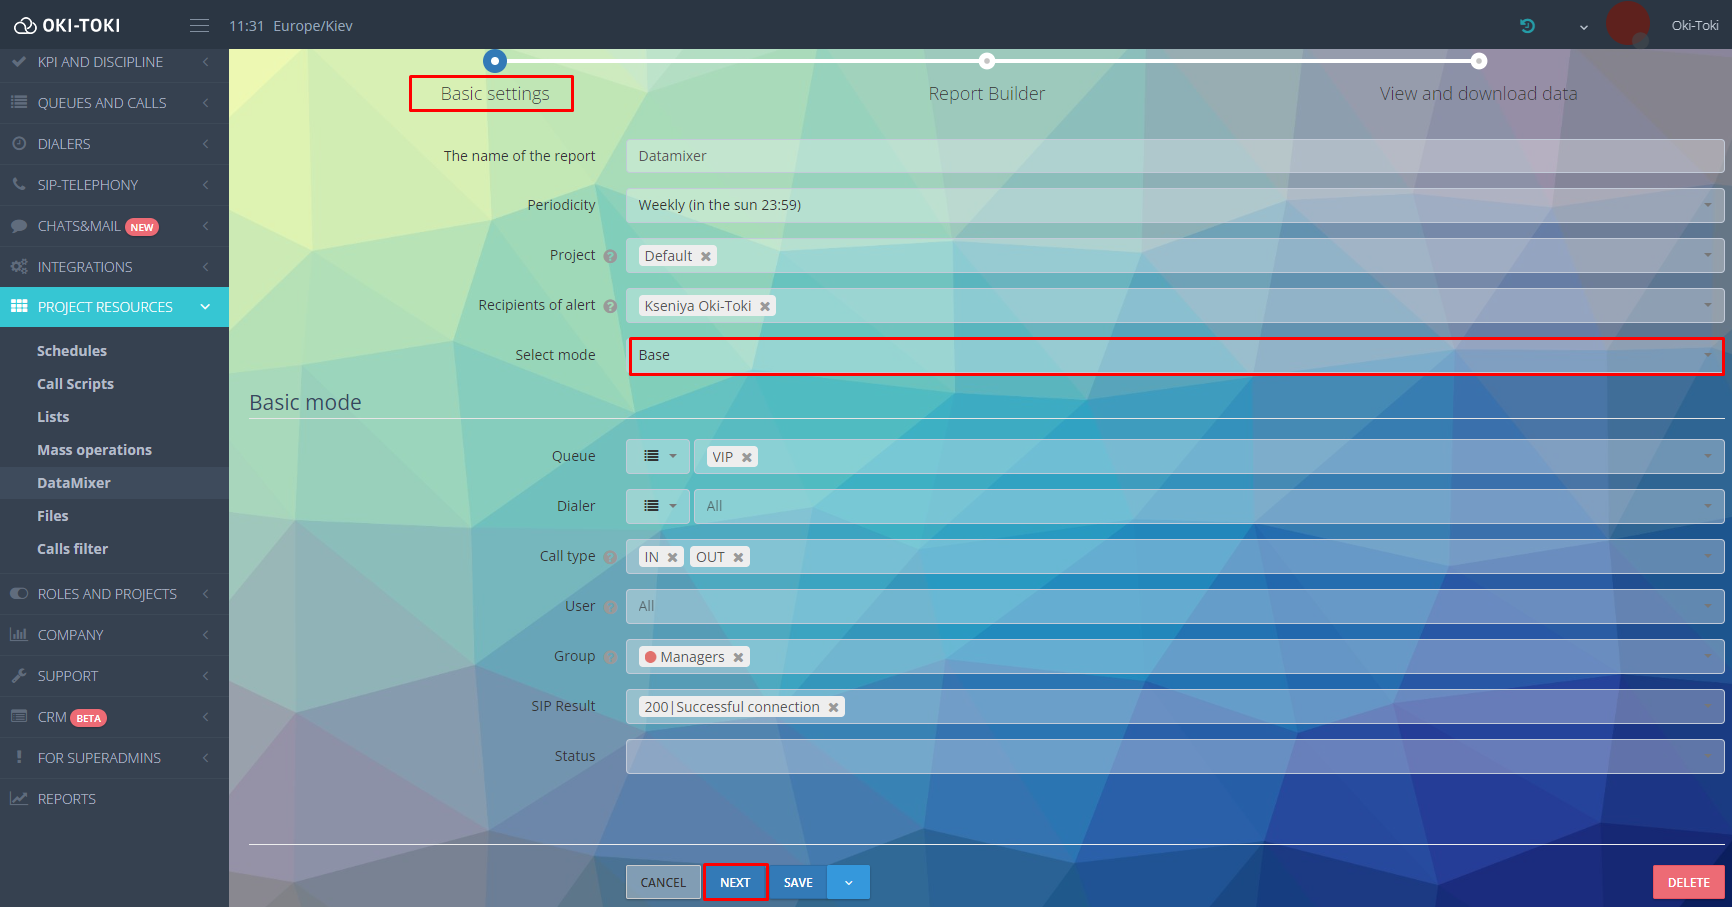
- basic – select the necessary filters in the DataMixer settings.
Specify Queue/Dialer, type of call, user or group. When generating the report, these parameters will be automatically considered. If filtering is not needed, you can leave the fields empty and move to the next stage by clicking the “Next” button;
- advanced – for manually forming links. In this mode, basic settings do not apply.
Stage 2: Report constructor
For the basic mode:
From the suggested list, select the needed reports with a list of available fields you can use. Combine data by marking the required fields with a “checkmark”.Links for journals in basic mode are already automatically formed, taking into account the selected parameters at the first stage, but some of the journals require additional data:
- for IVR Report choose a call script from the drop-down list;
- for Attempts Log at the first stage, fill in the “Dialers” field, specifying one or several dialers.
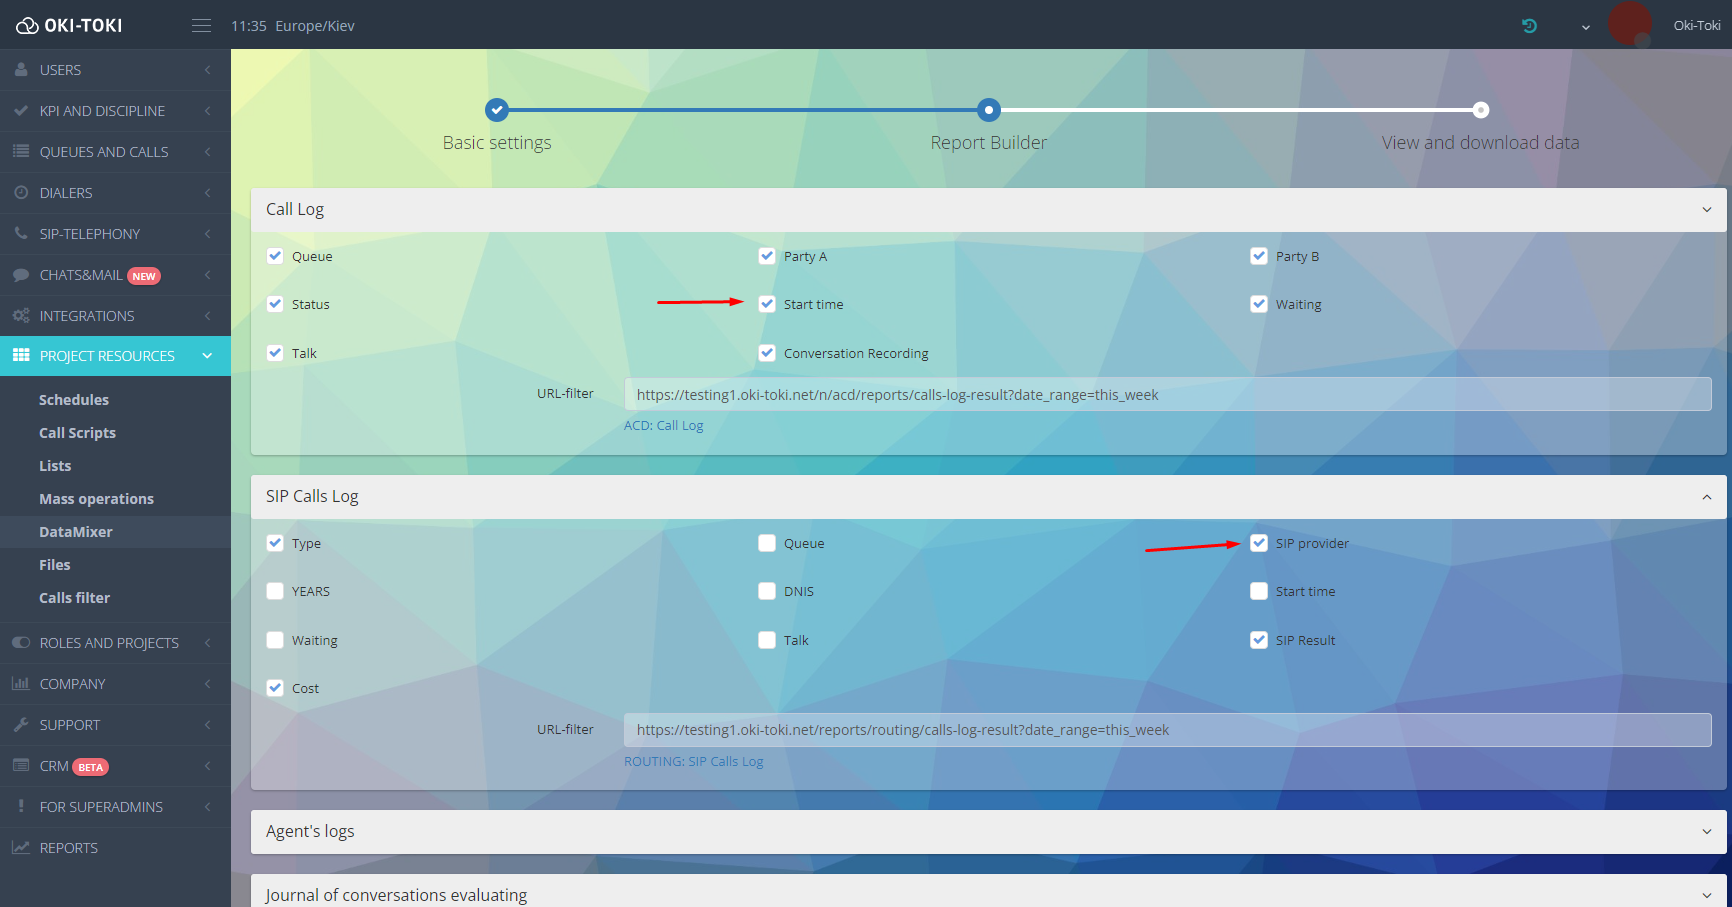
For the advanced mode:
- Select the report you need and go to it by the link;
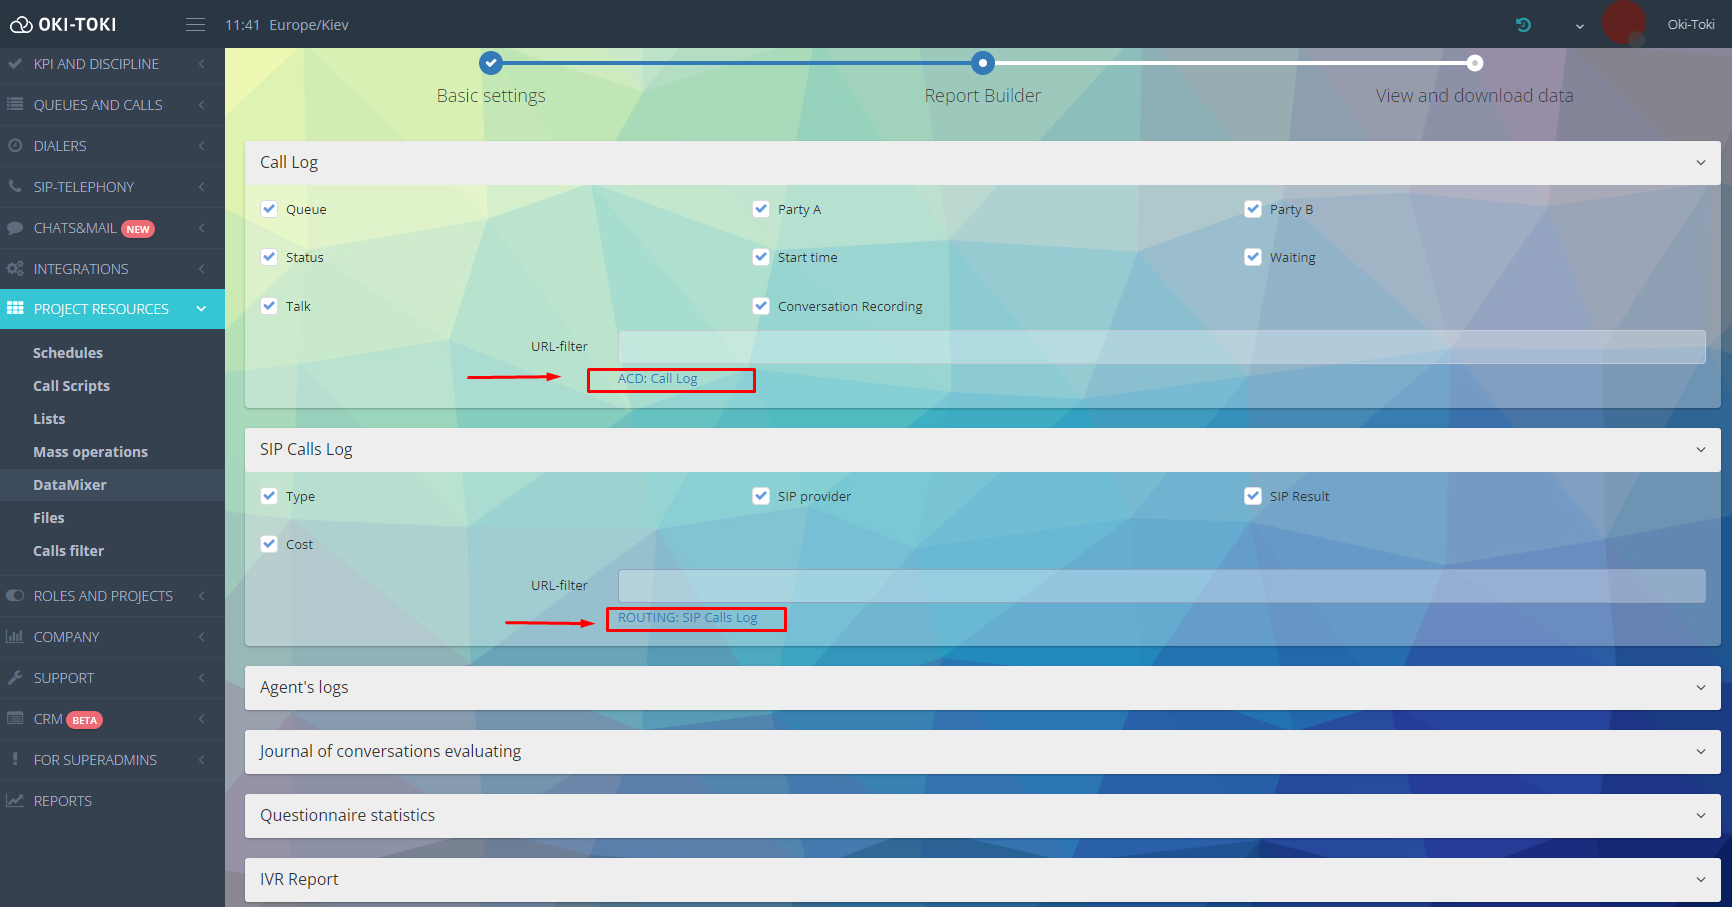
- Formulate the journal with the necessary filters.
- Copy the link of the prepared journal from the address bar
- Paste the link in the URL filter and select the required fields by marking them with a “checkmark”
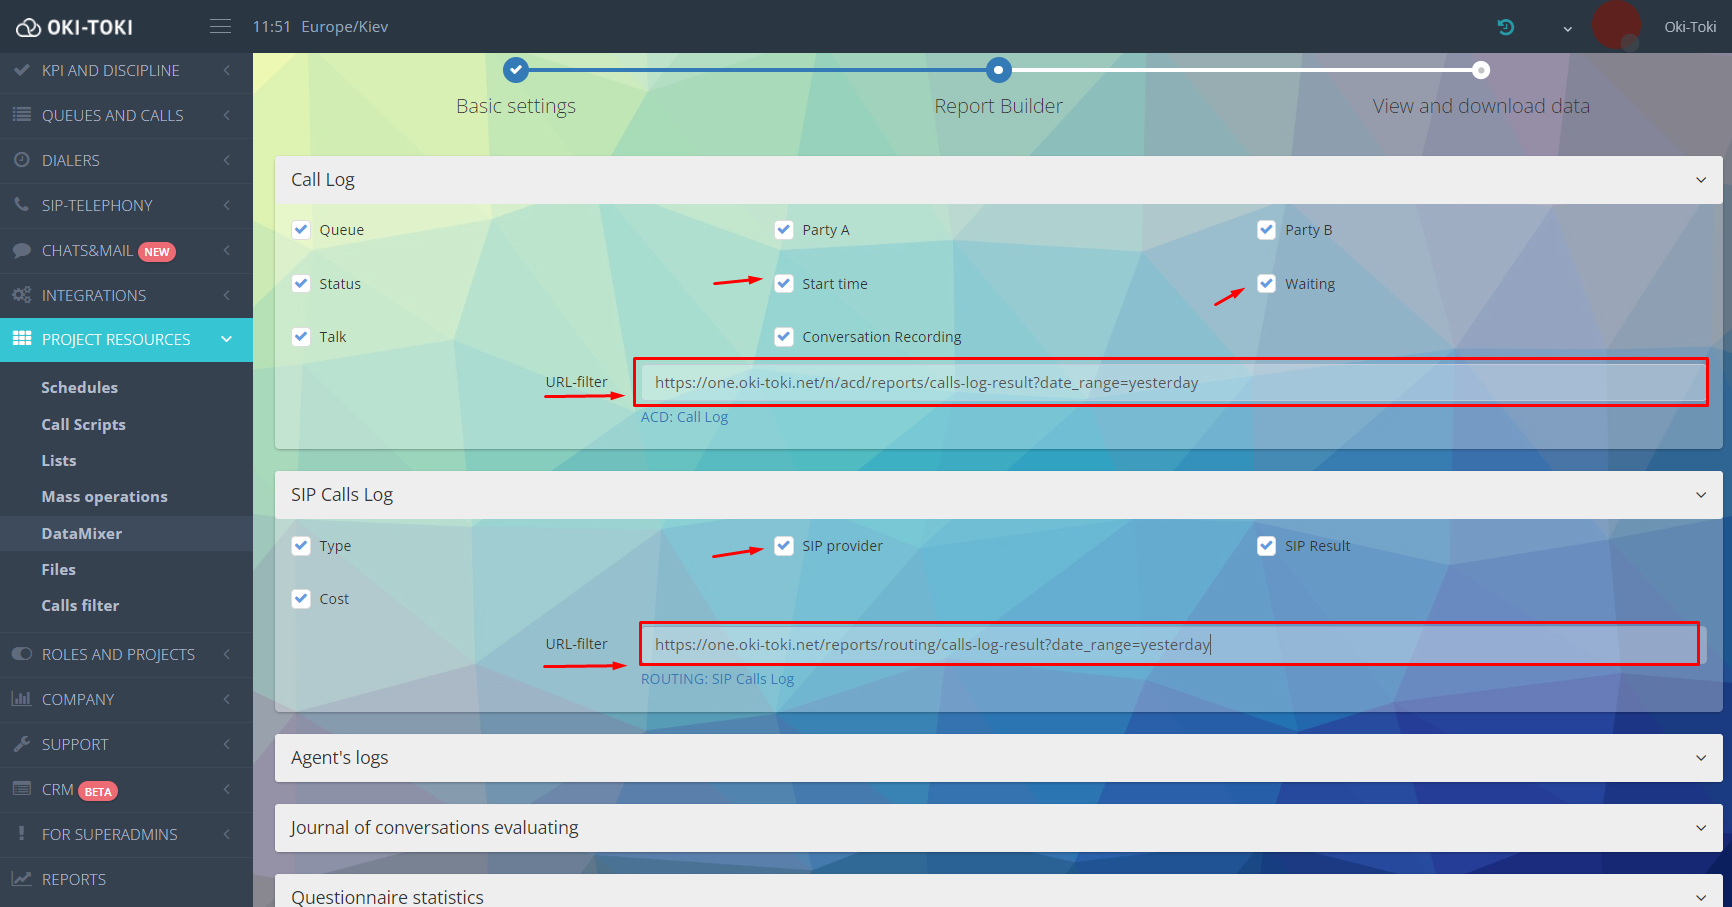
Important! Links must be for the same period or data will not be formed.
Stage 3: Viewing and downloading data
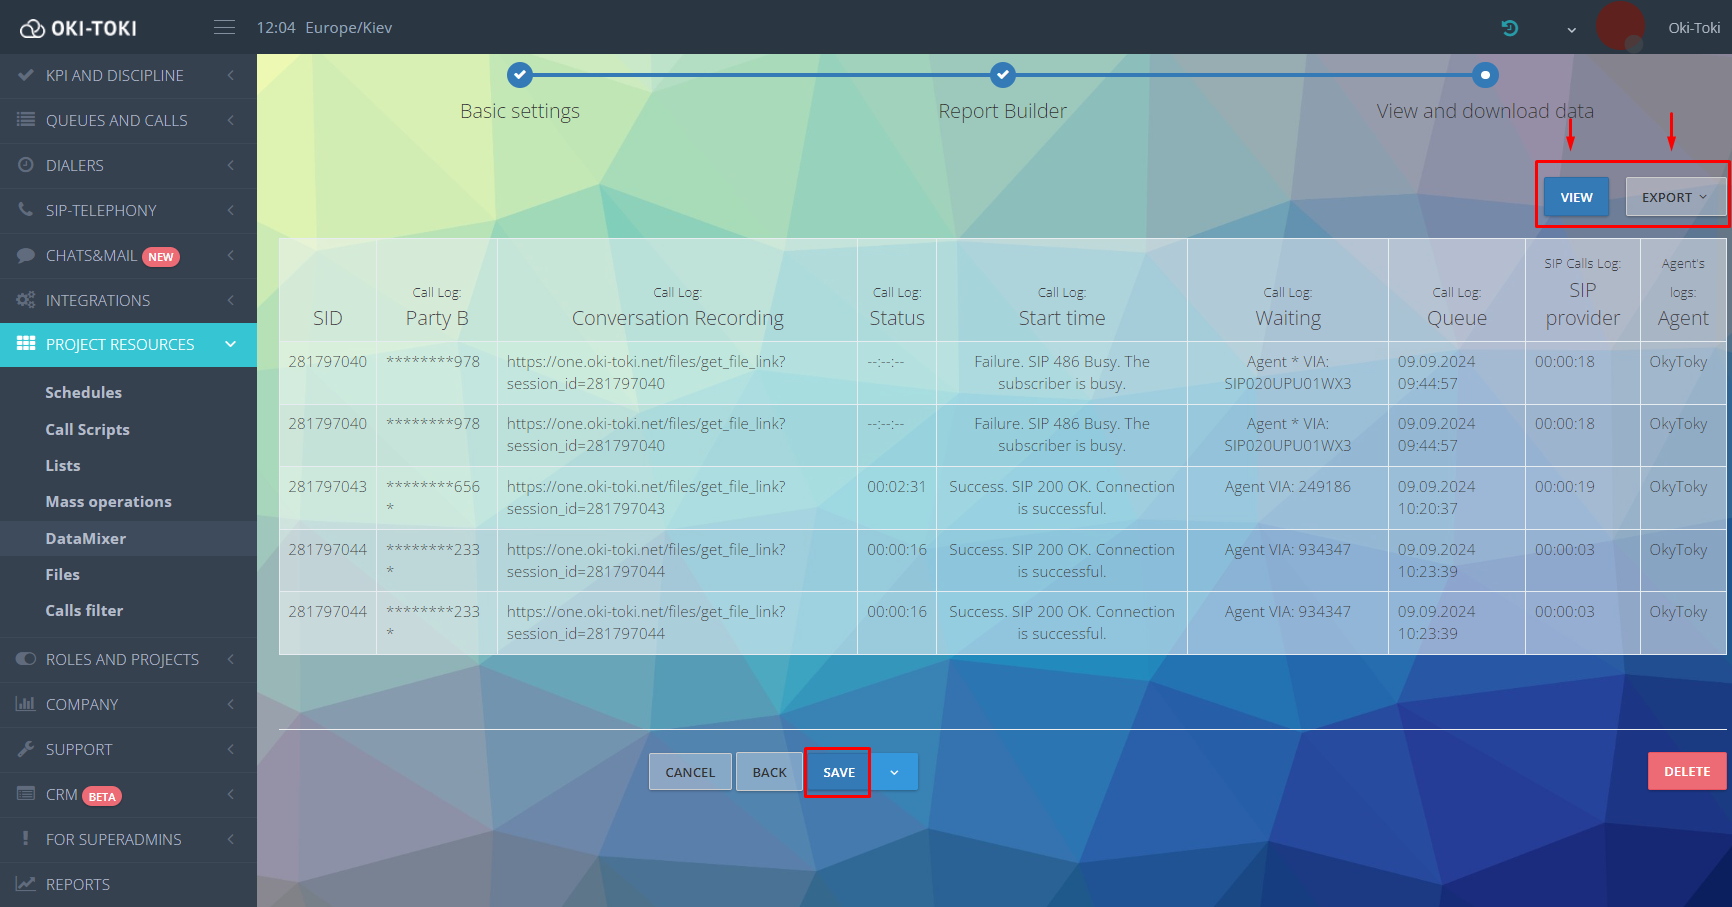
This is the last stage where you can check the correctness of the specified parameters before finalizing the report. For this, press the “Preview” button.
Important! In the preview, only part of the fields is displayed. The full report is available for export or for downloading from the link in the email.Once the report is ready, you will receive a notification email with a set frequency.Data can be exported in HTML, Microsoft Excel, Google Sheets formats for further analysis of the report.
Managing DataMixer reports
All created reports can be viewed in the Project Resources/DataMixer section. We changed the look of the list and added tiles with useful information:
- Status “Active/Inactive” – a switch allows you to enable/disable the tool. This is convenient if the call center temporarily stops the project but plans to resume it later. When needed, just turn DataMixer back on;
- Frequency, project, and notification recipient – displayed according to the selected settings;
- List of selected reports and fields, which were combined into one using the constructor;
- Files – an active link, clicking on which you can view the generation date, the number of collected rows, and download the file by clicking on “Download”.
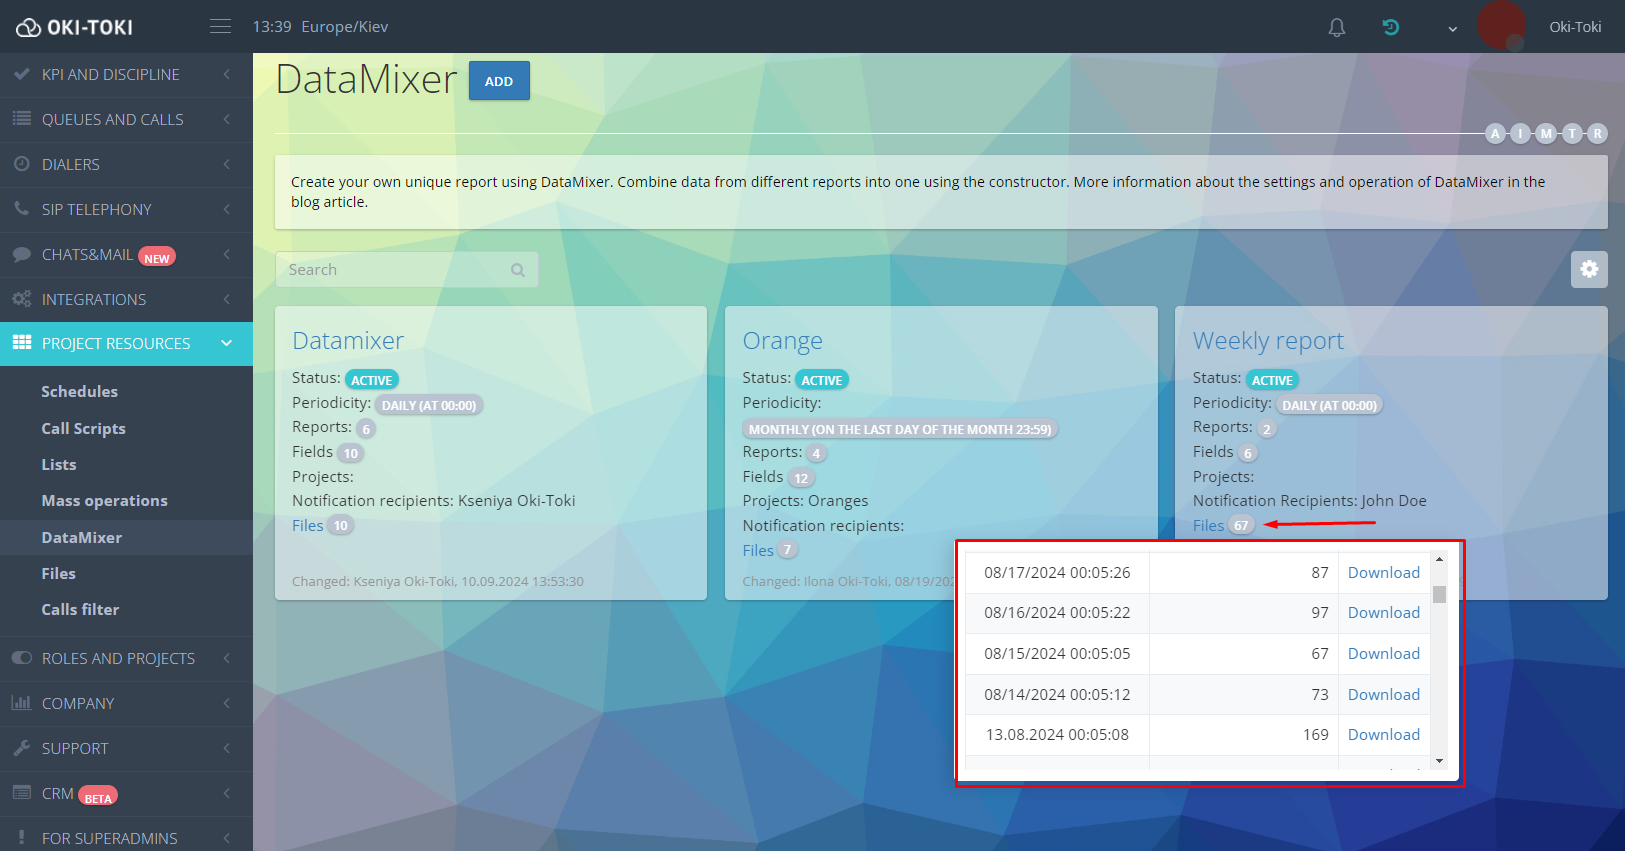
- Date and username, who made changes in the settings. An extended detail of modifications can be found in the logs.
What are the ways to create reports?
There are many variations of using DataMixer, and the end result will directly depend on the selected fields and types of reports.
Method 1: Efficiency of agents on the incoming line
At the first stage, select “queue” and call type “IN”, at the second – specify the fields:
- Agents log: agent, CRM process ID, duration;
- Call log: start time, conversation, status;
- Call evaluation log: check, scores, reviewer.
In the final report, there will be data about the operation of the incoming line: information about agents’ working time, duration of calls, statuses at the agent’s place, as well as quality ratings. This will allow you to assess the productivity of agents and the quality of their work based on the metrics obtained.
Method 2: Statistics on successful dialer calls and agent occupancy
At the first stage, select the required dialer and result “Success”. Check off the fields:
- From the Agents log: agent, CRM process ID, and start time of work.
- From the Attempts log: task number and attempt result.
The report will show the working time of agents and the results of each dialer attempt, including task number and successful calls. This will help compare agent occupancy and dialer efficacy.
Method 3: Result of dialer with voice menu
If a dialer is used with an interactive voice menu – add IVR Report to Call log and Attempts log. Choose the “IVR” field and the necessary call script to get data on calls passing through the voice menu and their effectiveness.You will be able to see how many calls successfully went through the IVR script and the result of each attempt. This will give an understanding of how efficiently the voice menu works and how it affects the overall success of calls.Configure DataMixer by adding different fields to obtain statistics for your tasks and work specifics.
How to make an effective report for a call center?
Simple steps will allow you to easily collect the necessary information:
- Identify tasks, metrics, and data you need for analysis;
- Select the needed reports and fields — combine different journals, according to your goals;
- Use filters to select only the information that is most important, for example, calls by a specific project;
- Automate the DataMixer process on a regular basis, choosing the frequency;
- Analyze the results and improve business processes by increasing the performance indicators of the call center.
These tips will help create a report that accurately reflects your call center’s operation and simplifies data analysis.With DataMixer by Oki-Toki, you can create reports for different projects, which increases its versatility. An intuitive interface and easy setup will help you gather statistics, simplify the monitoring process, and optimize call center business processes.

